React Data Display and Feedback Components
34 components, 17 free · React, TypeScript and Tailwind CSS, light and dark
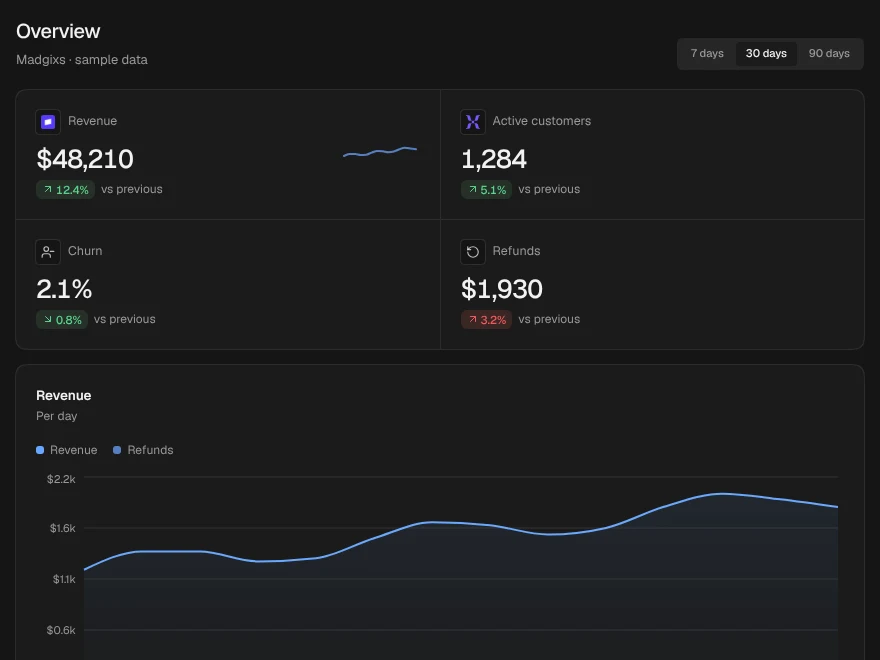
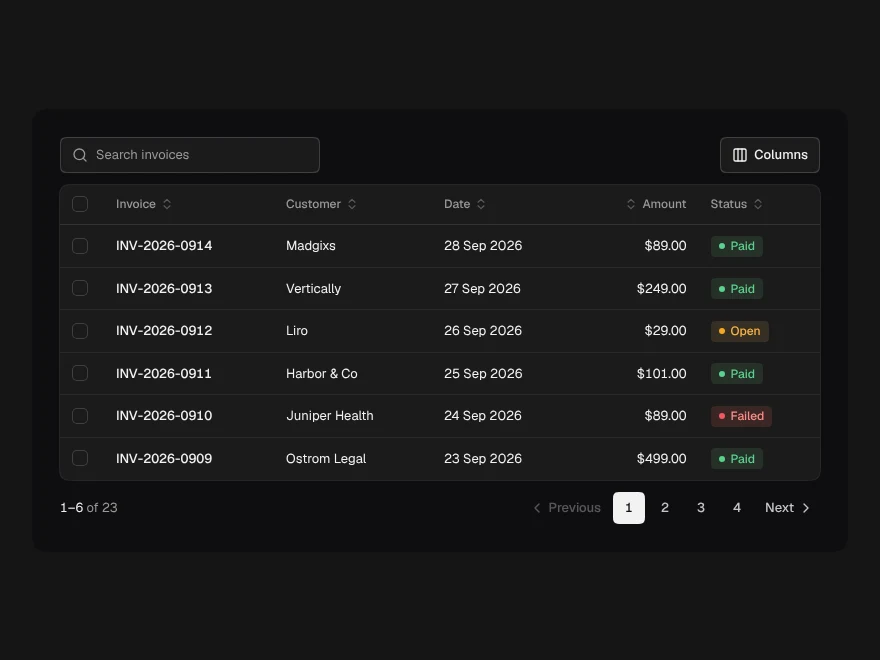
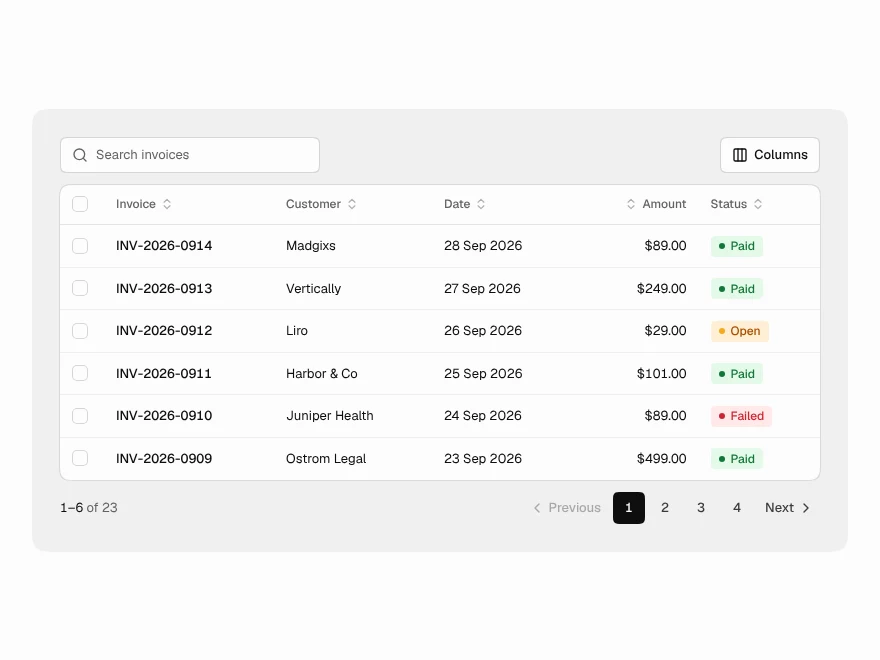
The Data Table handles sorting, search, row selection, bulk actions, column visibility and pagination with TanStack Table. Charts cover area, bar and donut, KPI cards and sparklines, each with a data table for screen readers.
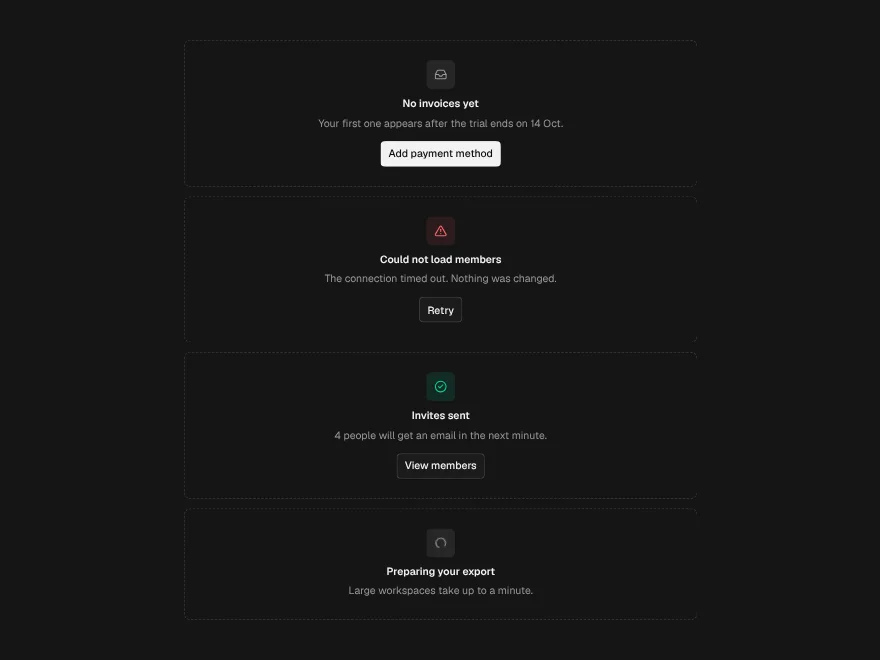
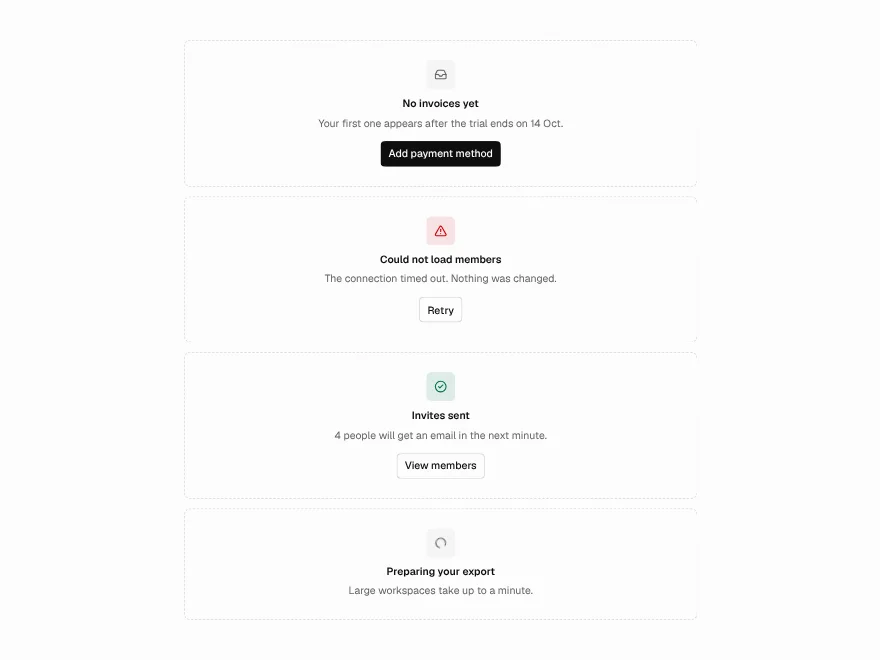
Badges and states fill the gaps between: empty, error, success and loading screens, each with a title, a sentence and one action, plus skeletons.
How to build a React dashboard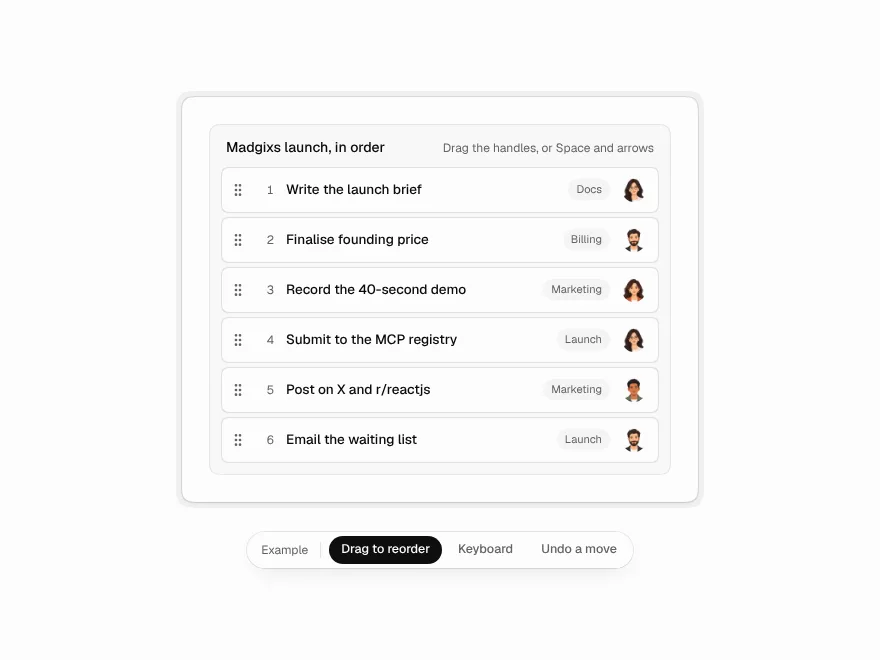 NewFree
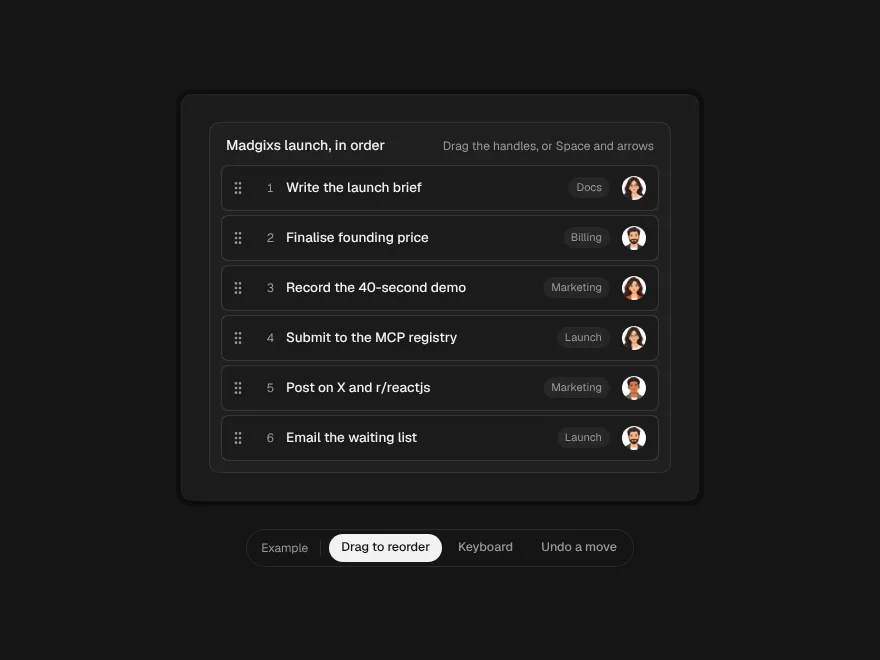
Sortable List
A list you reorder by dragging its handles or with the keyboard, with every move undoable.
 NewFree
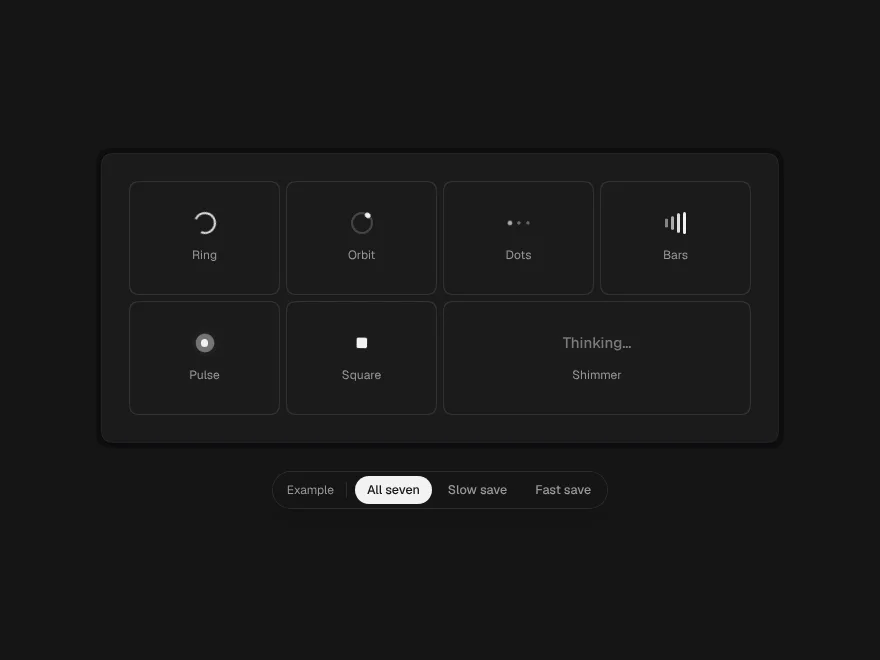
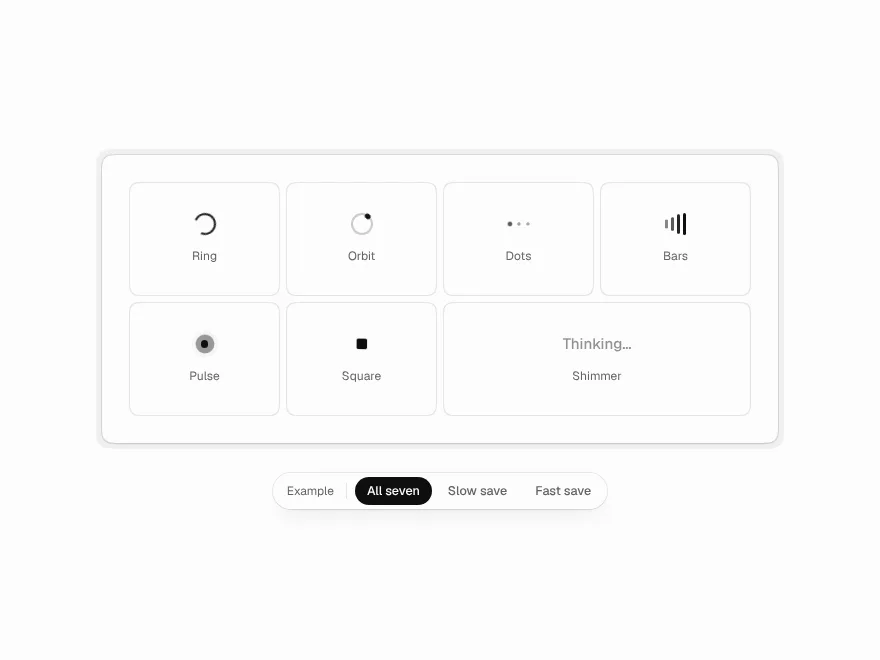
Loaders
Seven small loaders and a hook that stops quick replies from flashing a spinner.
 Pro
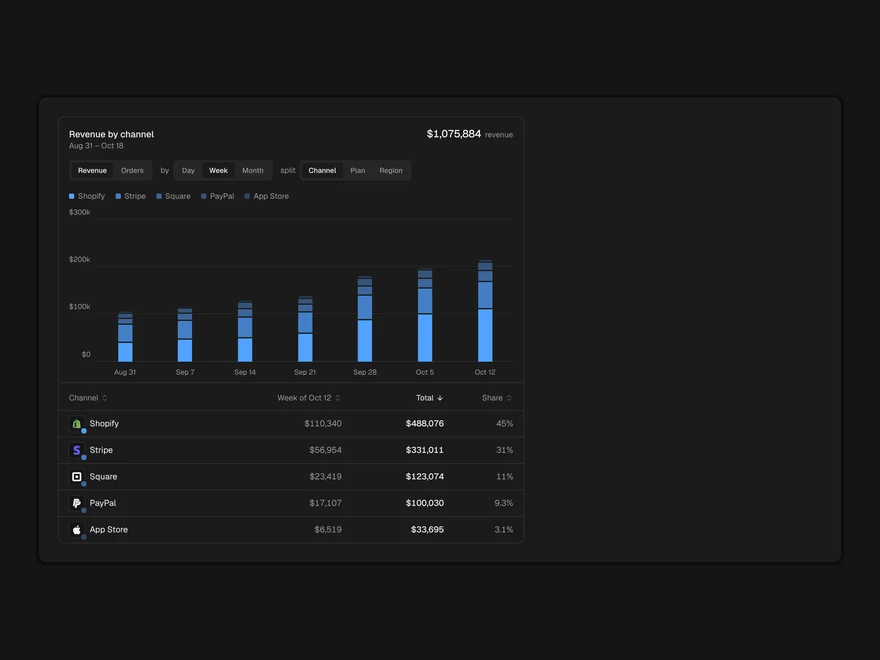
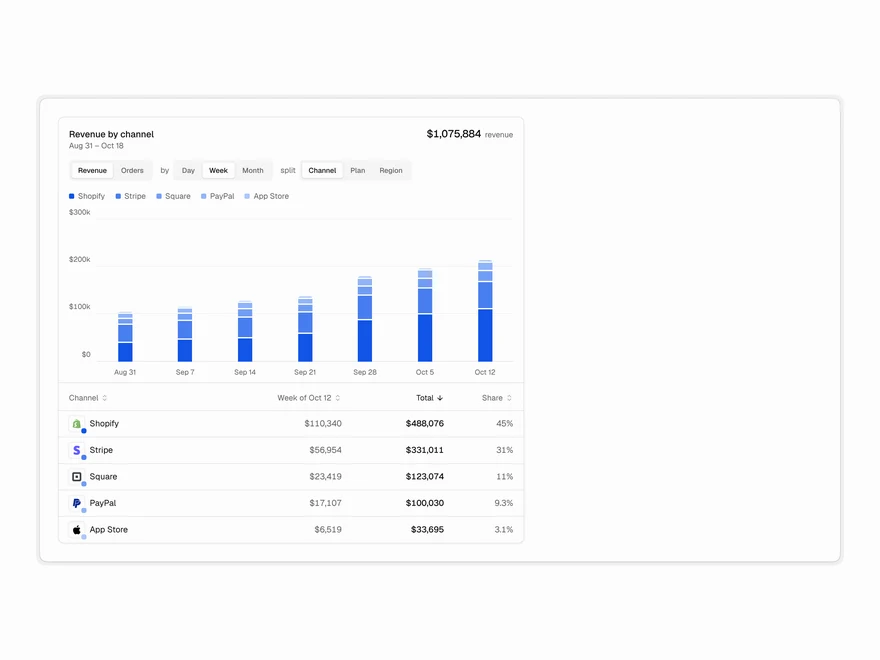
Breakdown Chart
Stacked bar chart with breakdown table.
 Pro
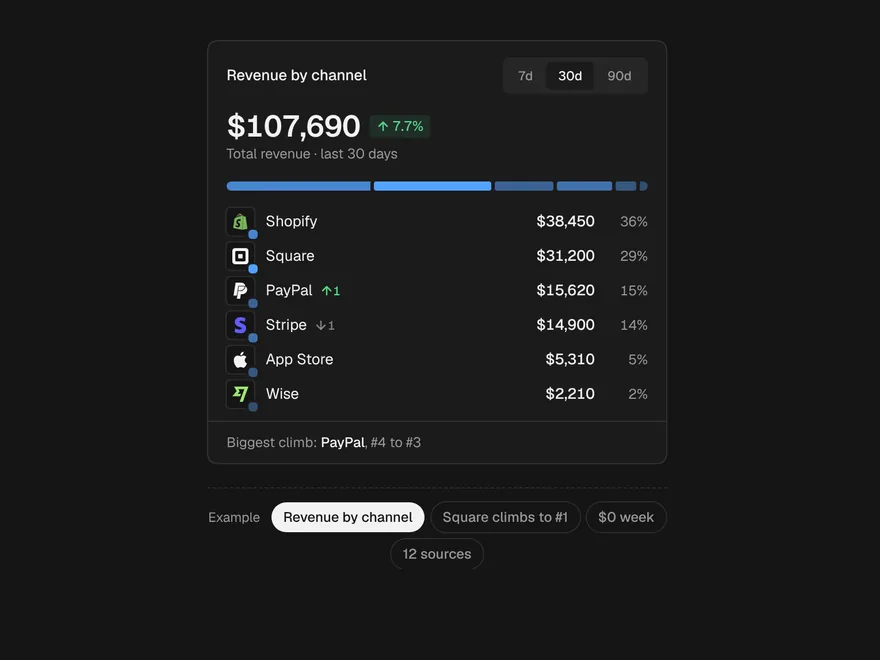
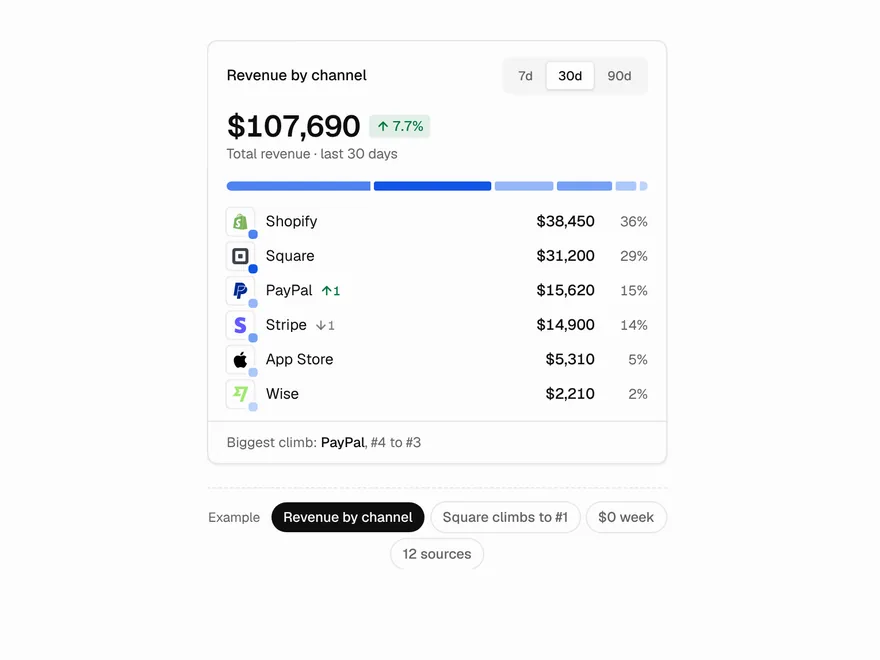
Compact Breakdown
Small card splitting a total into parts.
 Pro
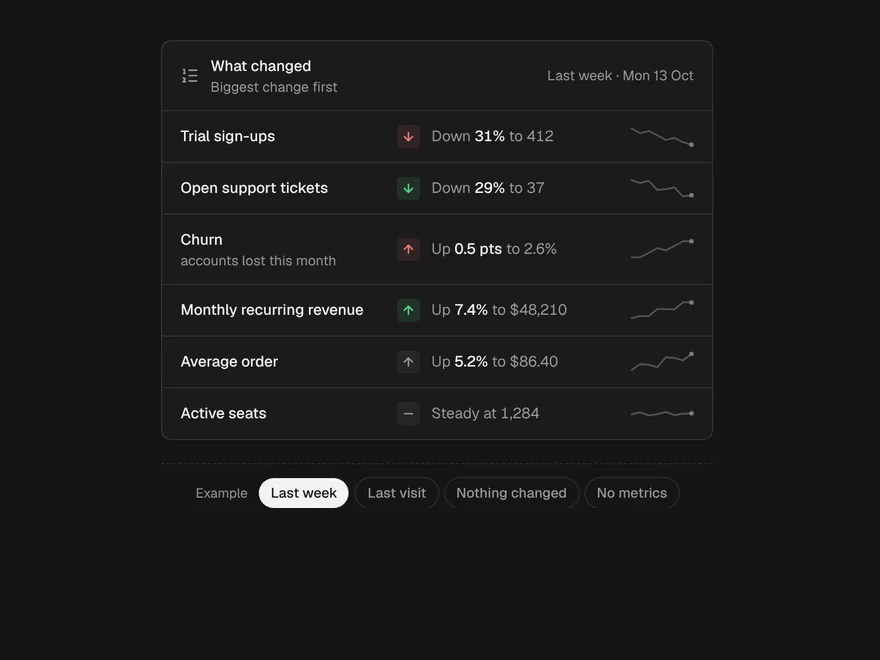
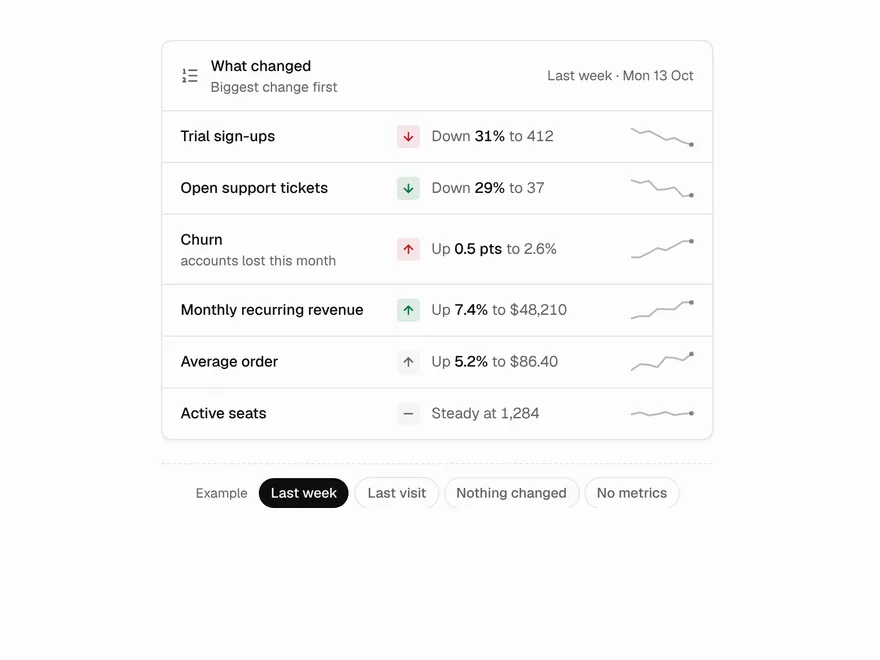
Change Summary
What changed since last time, by metric.
 Pro
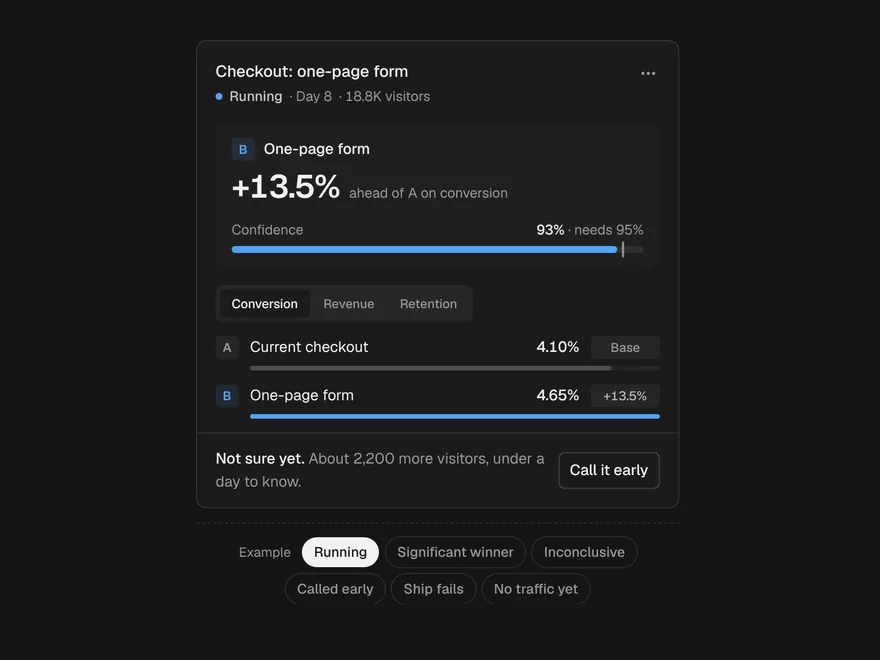
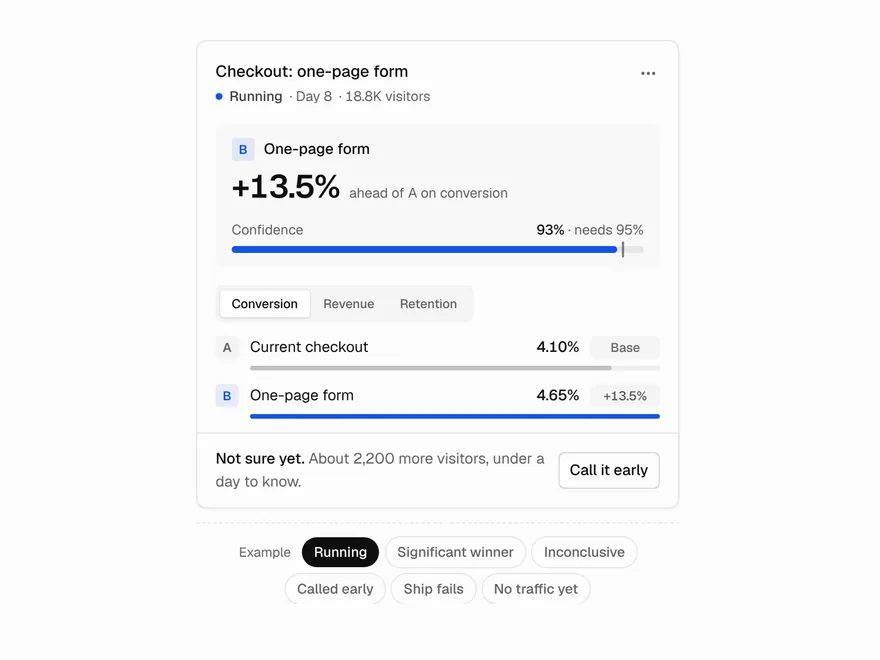
Experiment Card
A/B test result card.
 Free
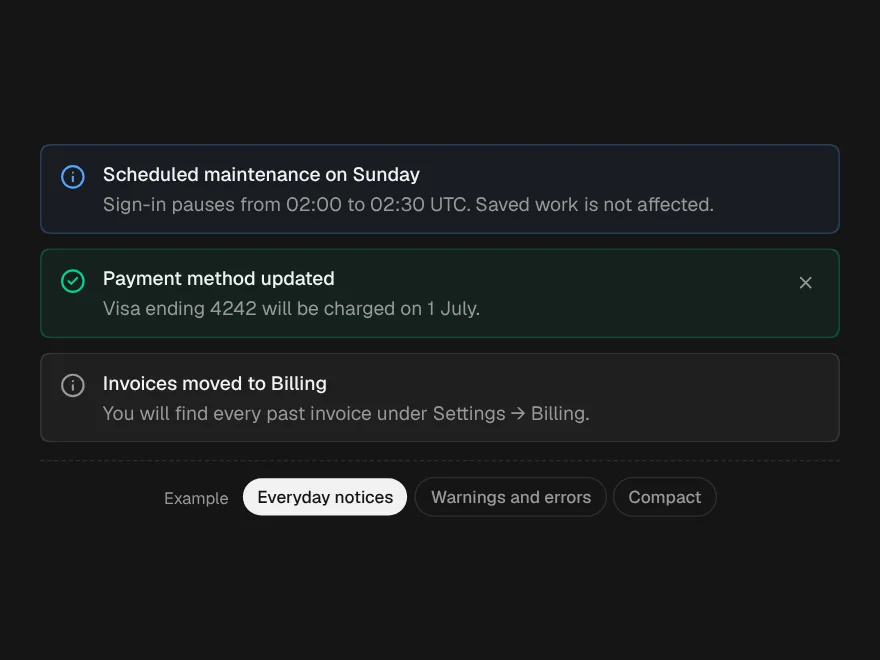
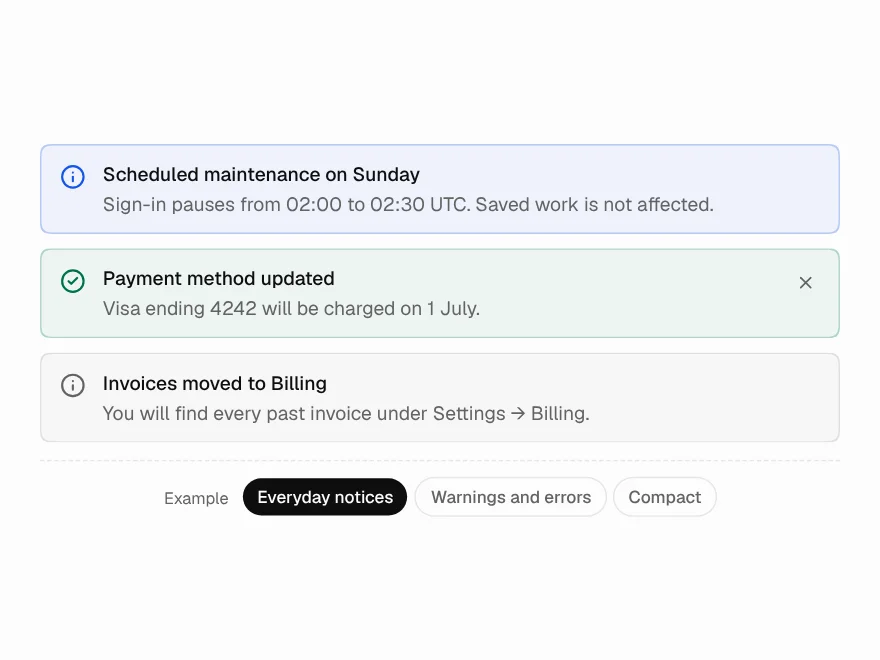
Alert
Inline alert in five tones.
 Free
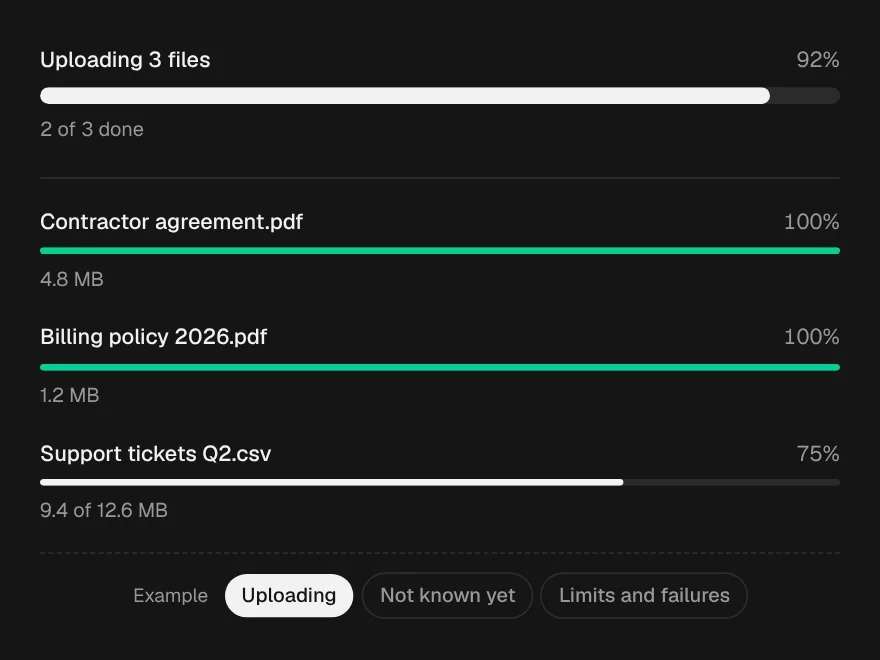
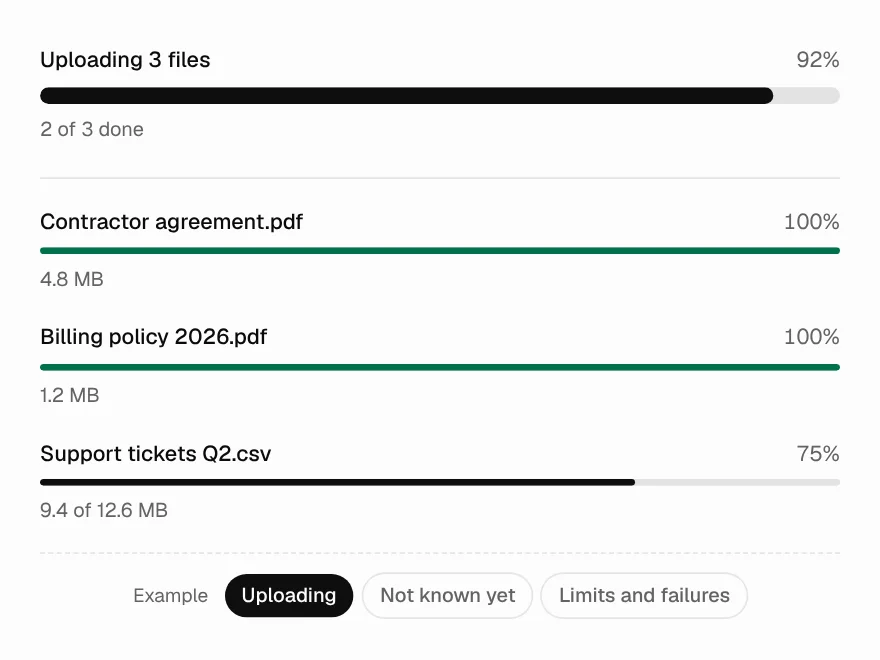
Progress Bar
Progress bar.
 Free
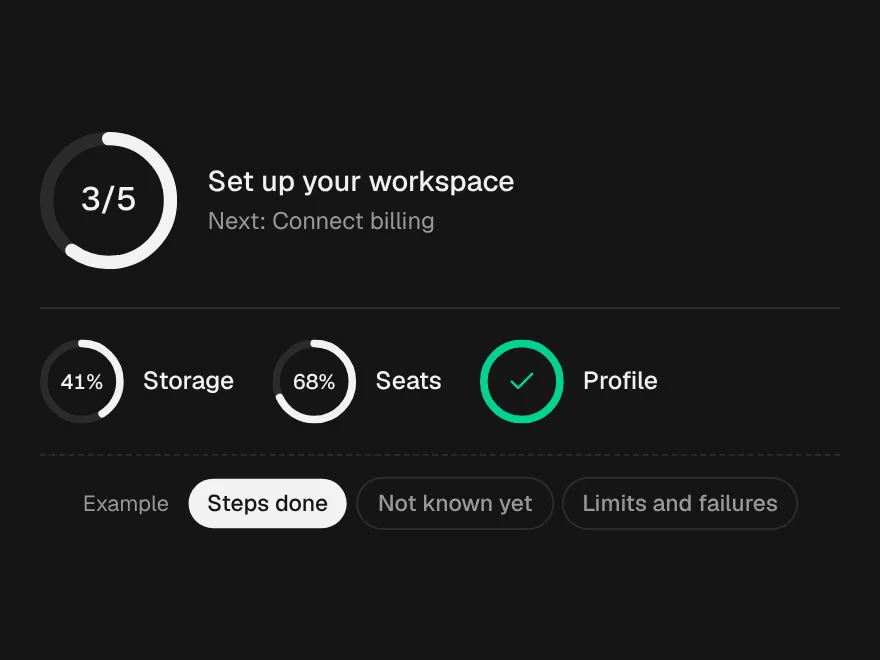
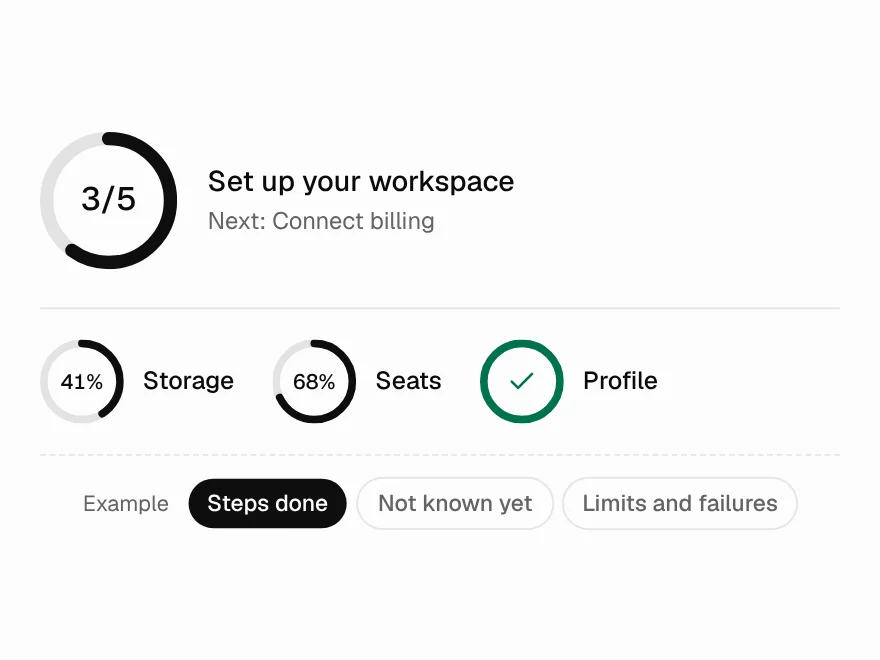
Progress Circle
Circular progress ring.
 BlockPro
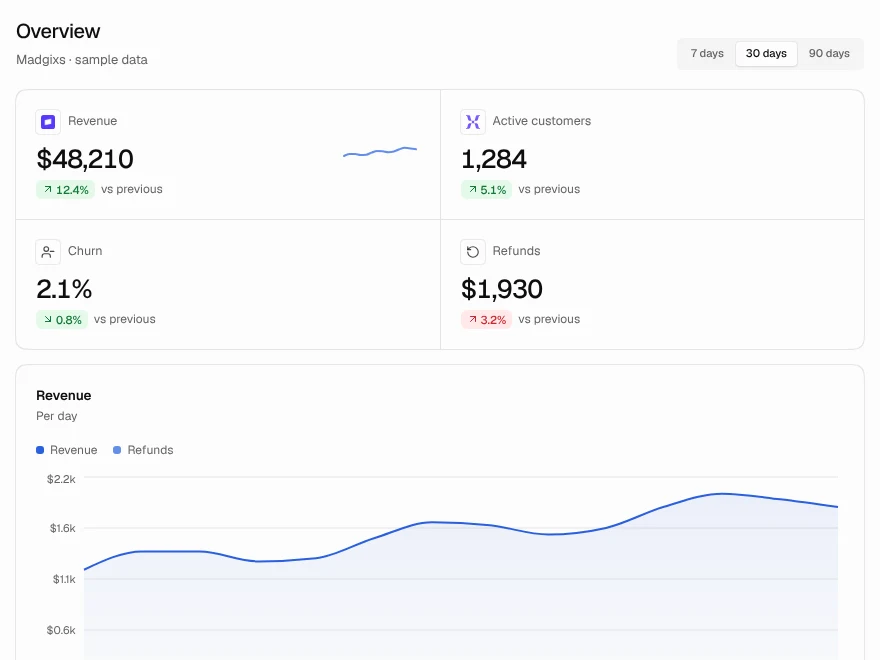
Dashboard
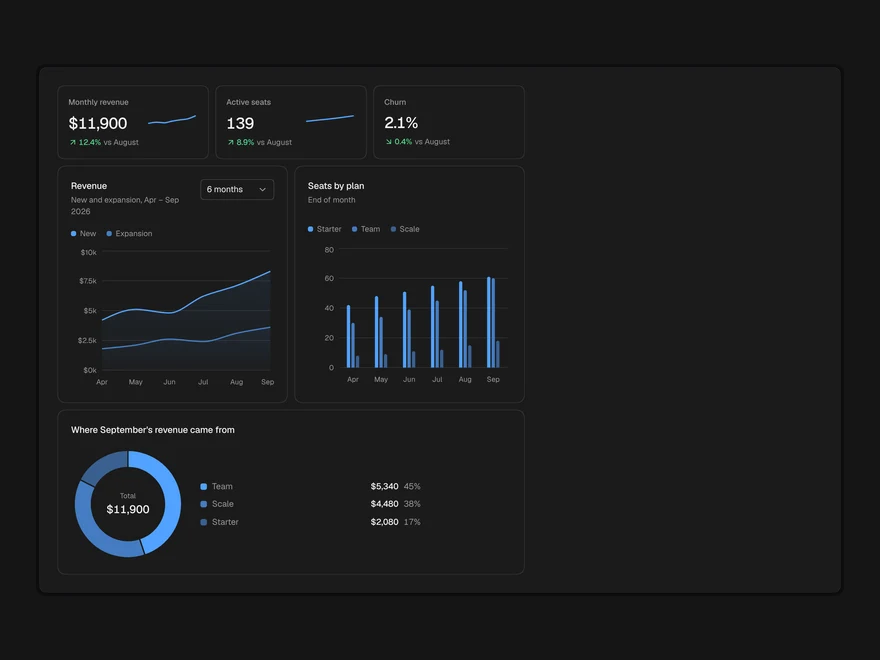
Complete analytics dashboard screen.
 Free
Data Table
Data table with sorting, search and pagination.
 Free
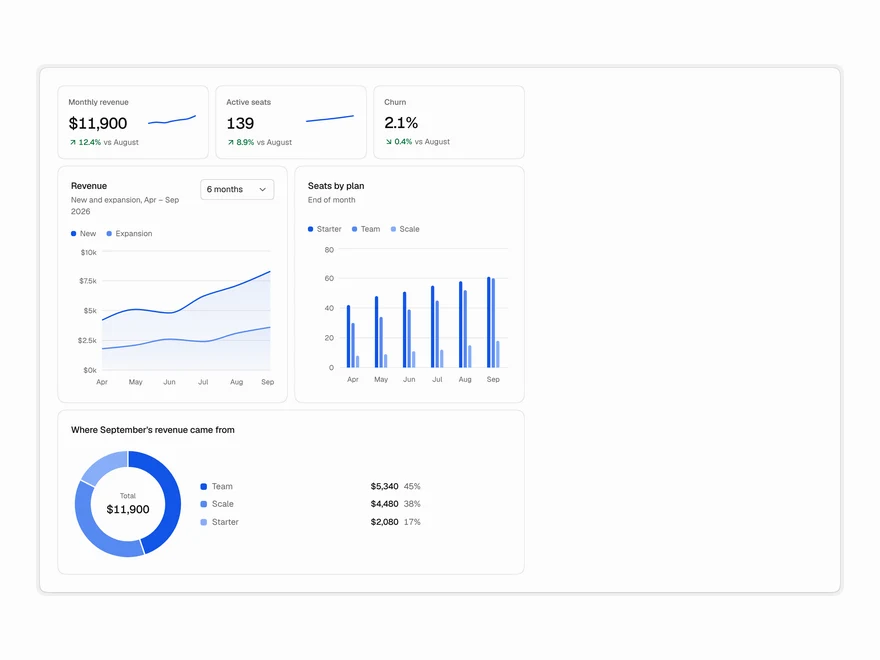
Charts
Area, bar and donut charts with KPI cards.
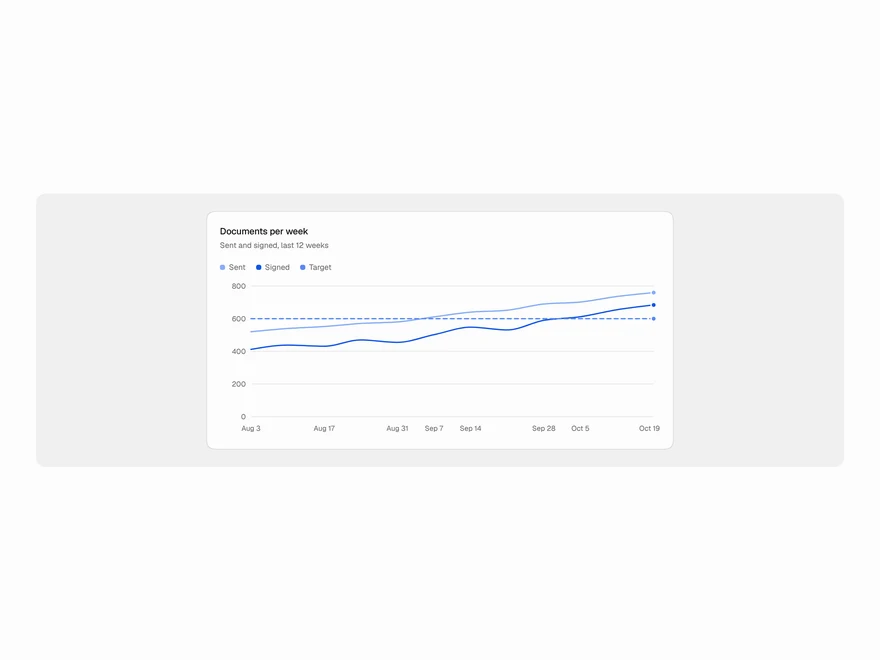 Free
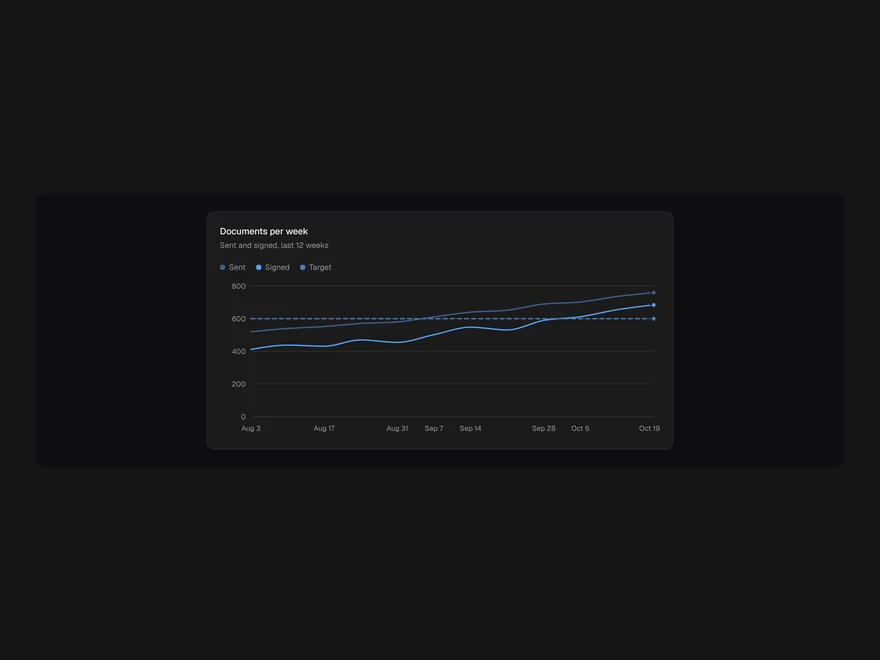
Line Chart
Line chart for trends over time.
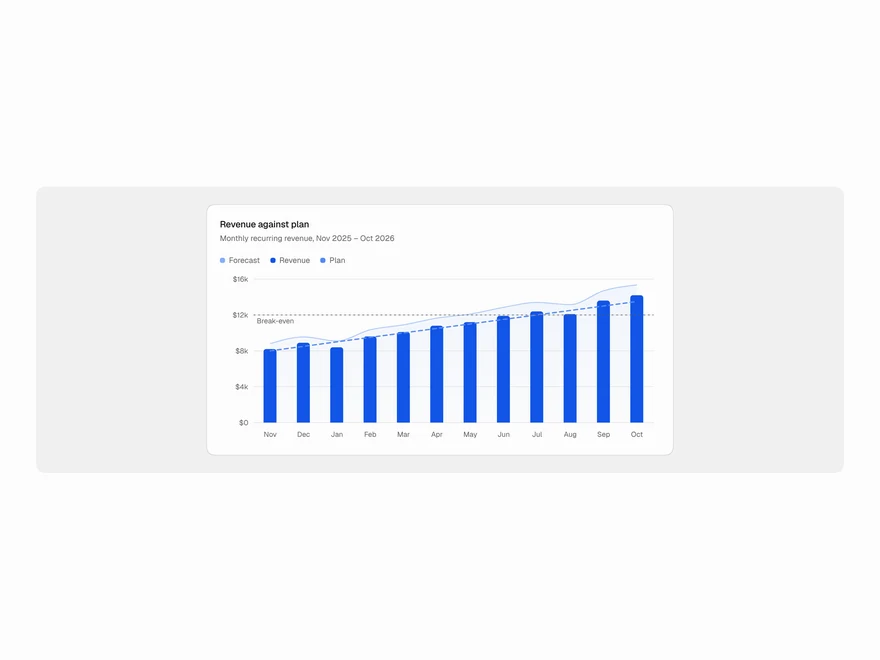 Pro
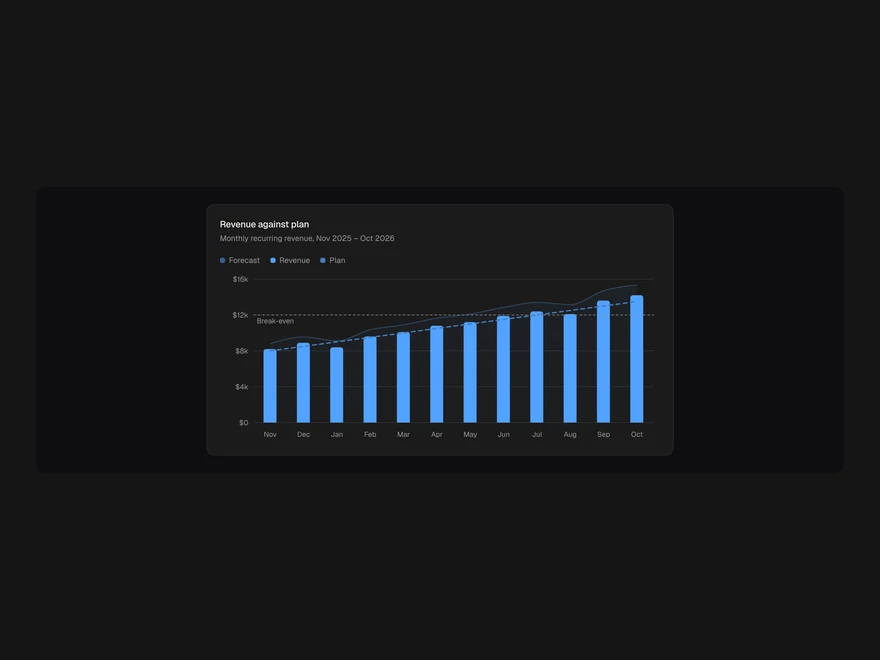
Composed Chart
Combined bar, line and area chart.
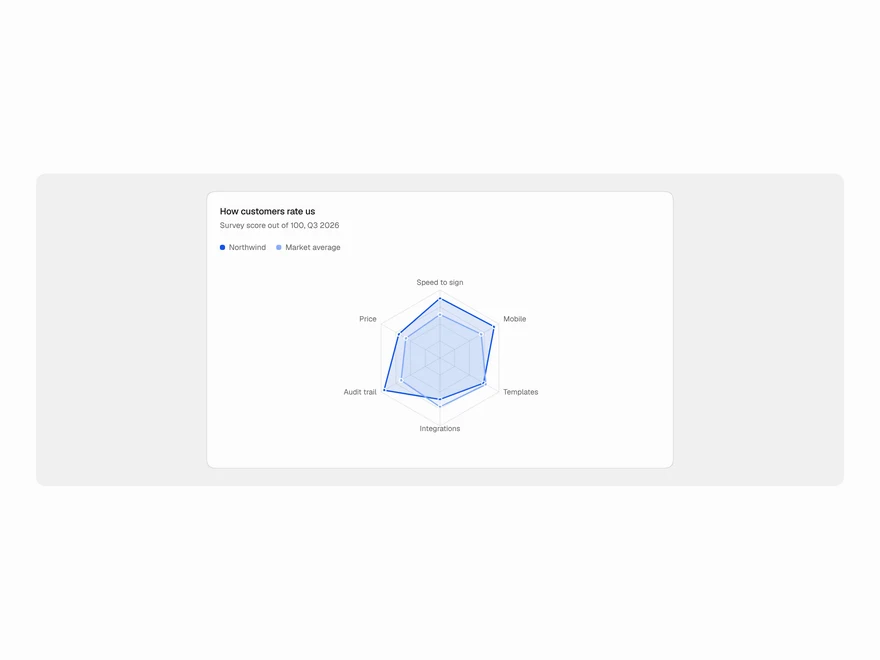 Pro
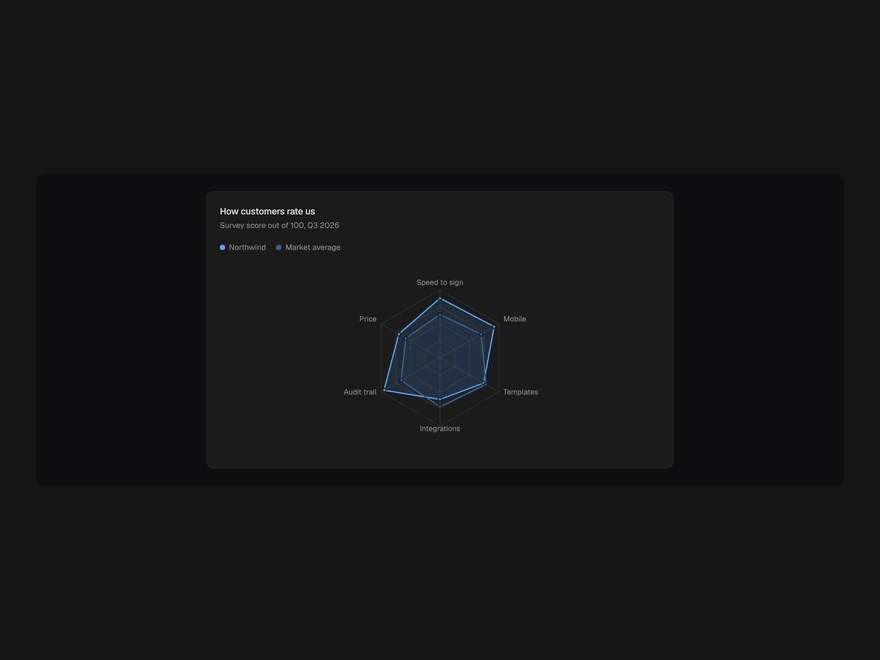
Radar Chart
Radar chart for comparing measures.
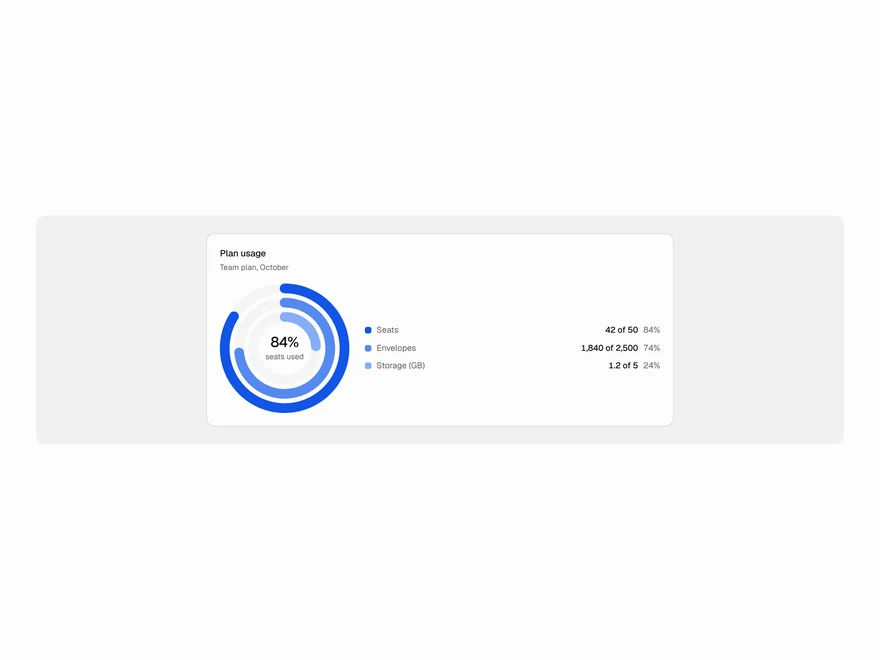 Pro
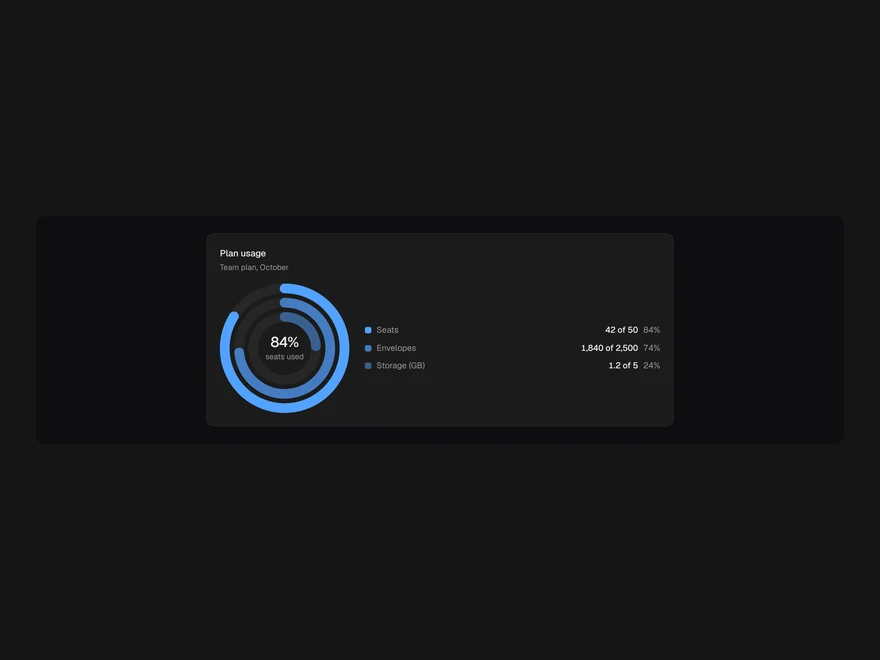
Radial Chart
Radial progress and share chart.
 Pro
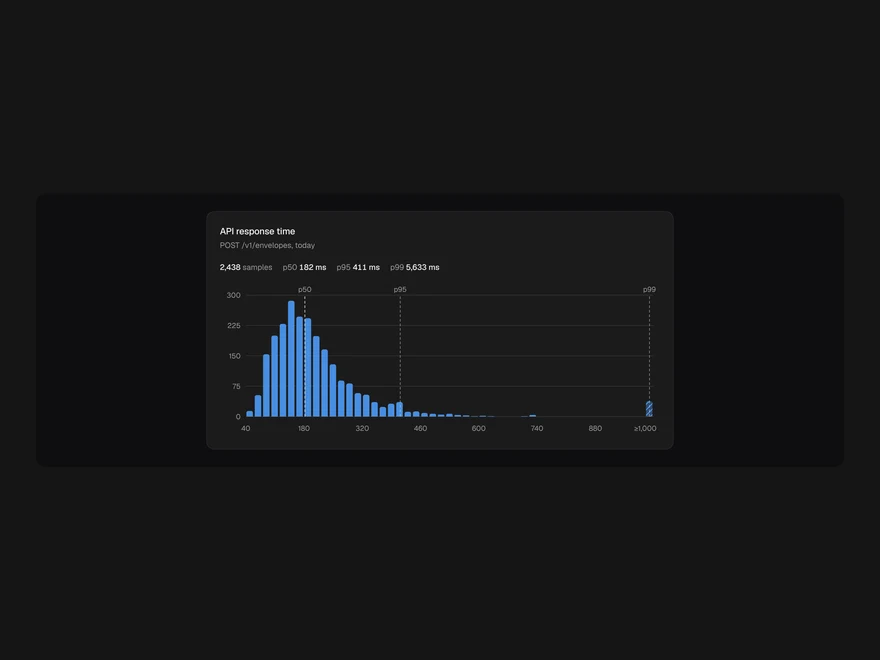
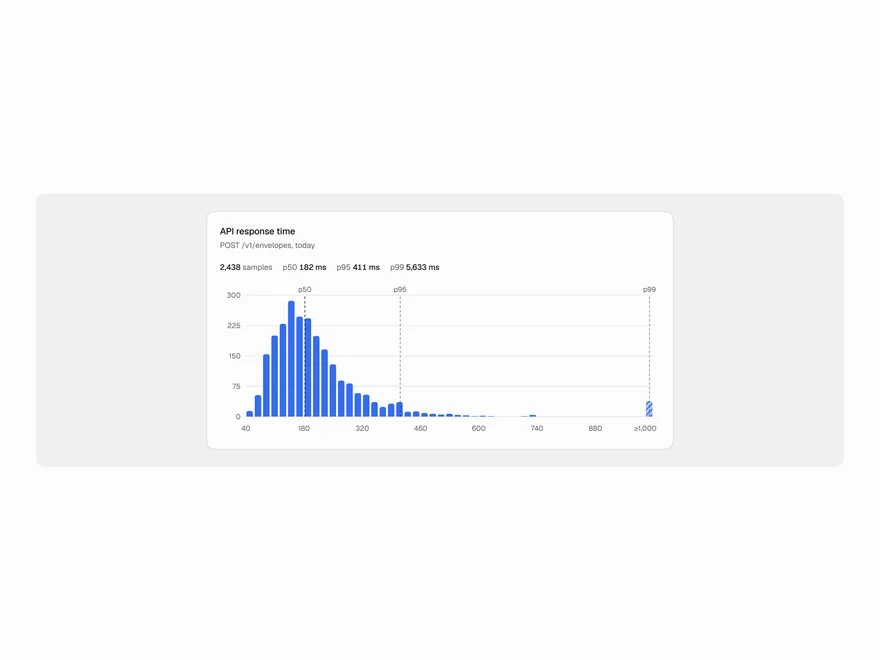
Histogram
Histogram with p50, p95 and p99 markers.
 Pro
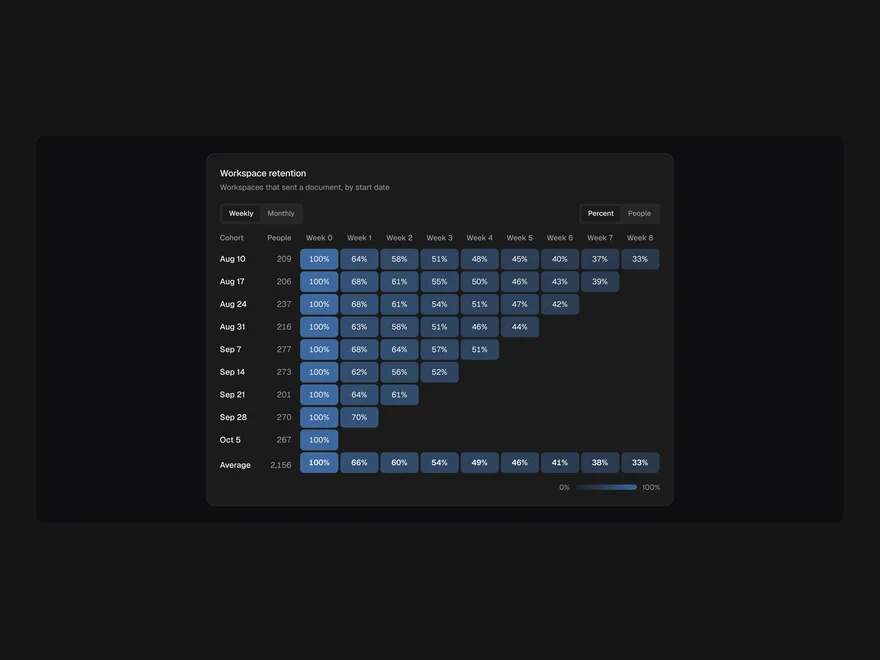
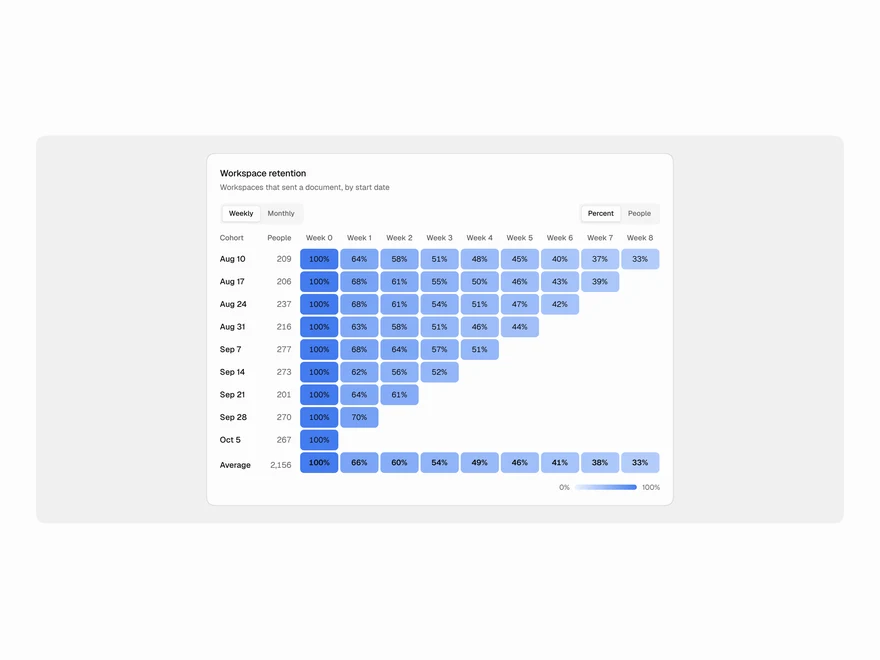
Cohort Retention
Cohort retention table.
 Pro
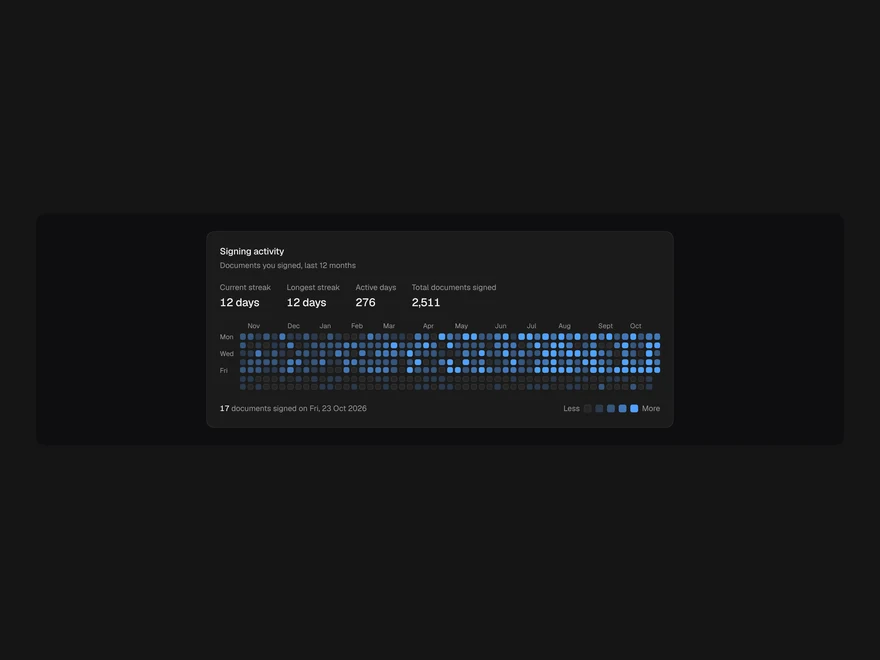
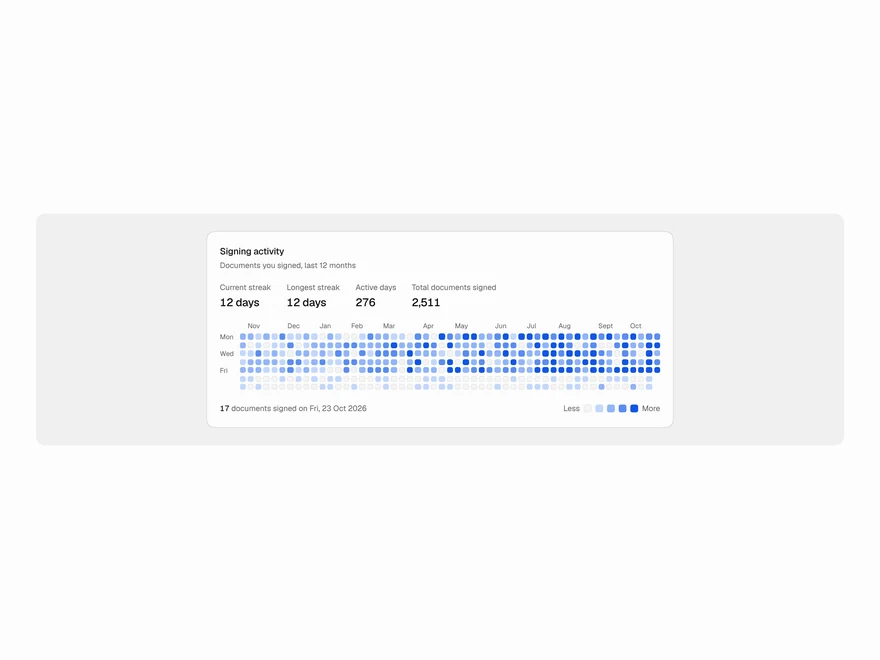
Calendar Heatmap
GitHub-style calendar heatmap.
 Pro
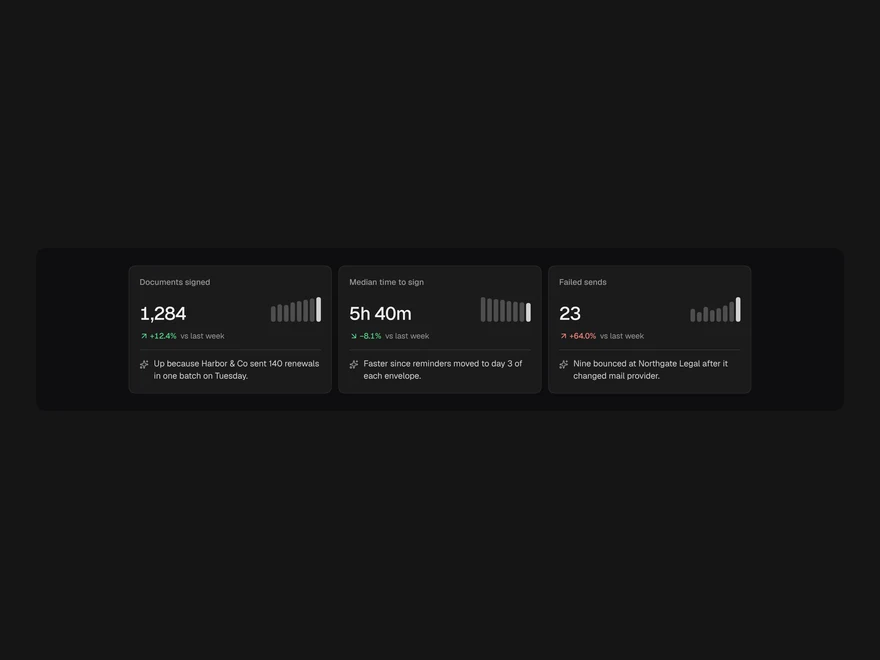
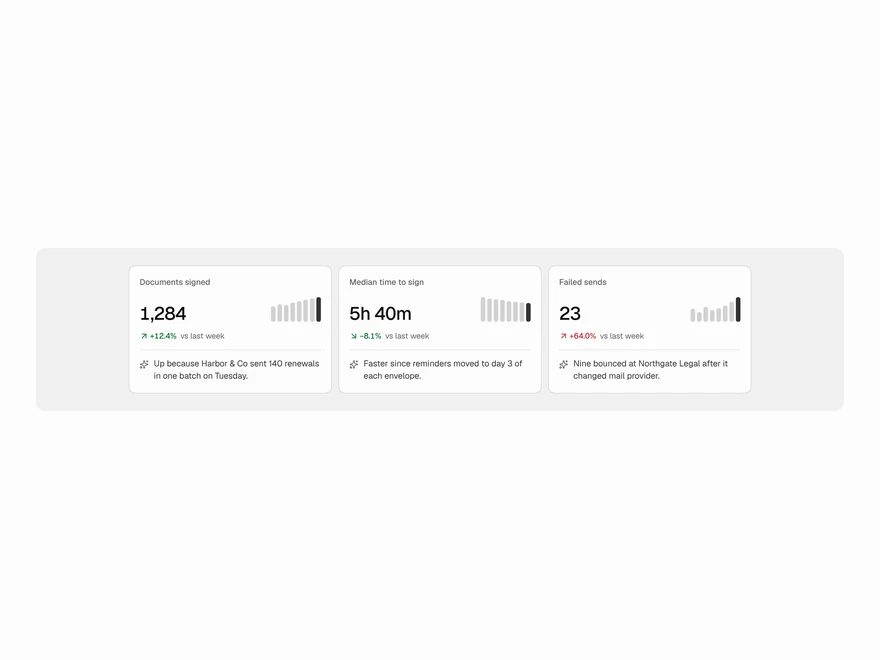
Insight Cards
KPI card with trend and AI insight.
 Free
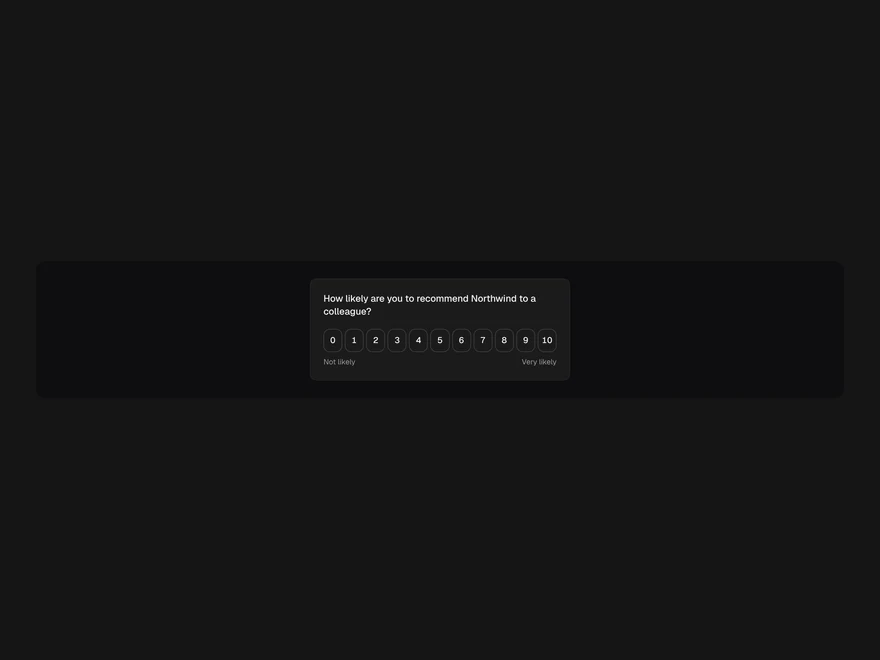
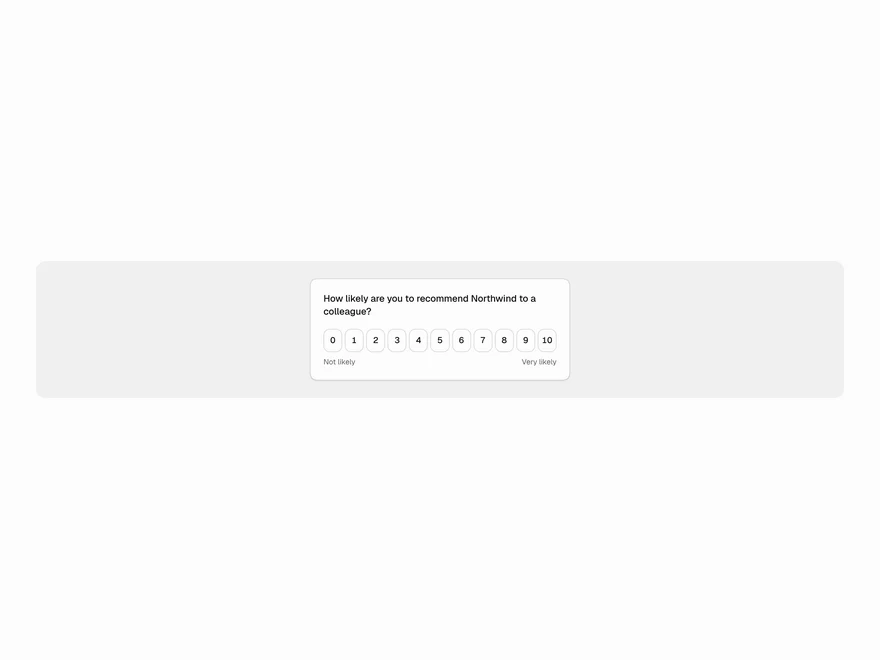
Feedback Widget
Feedback widget with NPS, emoji or stars.
 Free
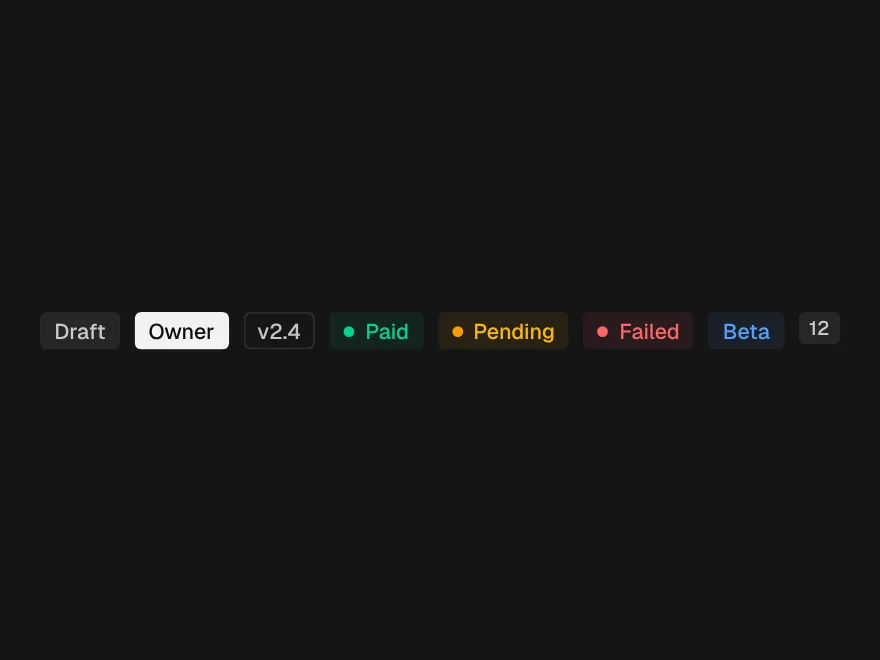
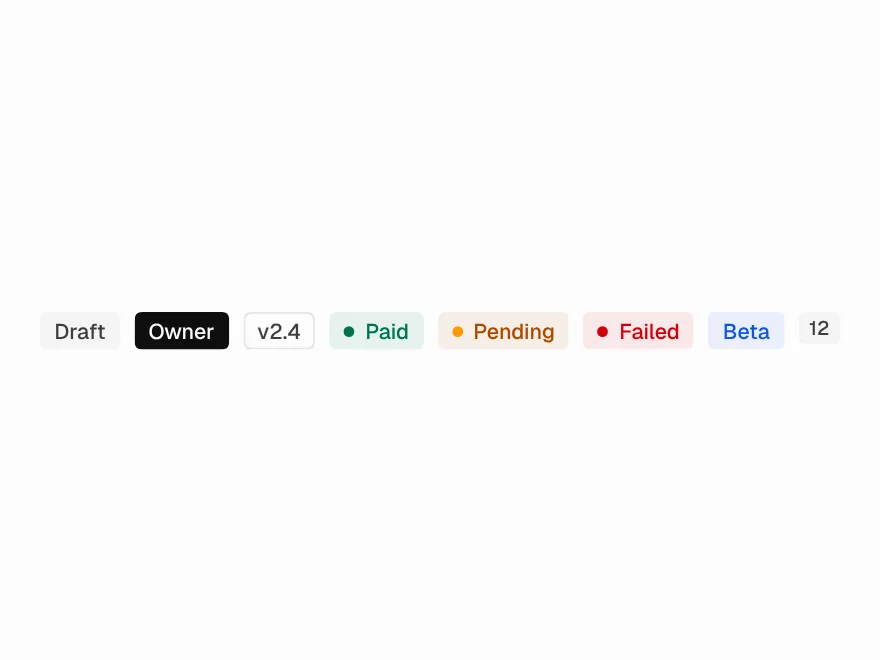
Badge
Status badges in seven colours.
 Free
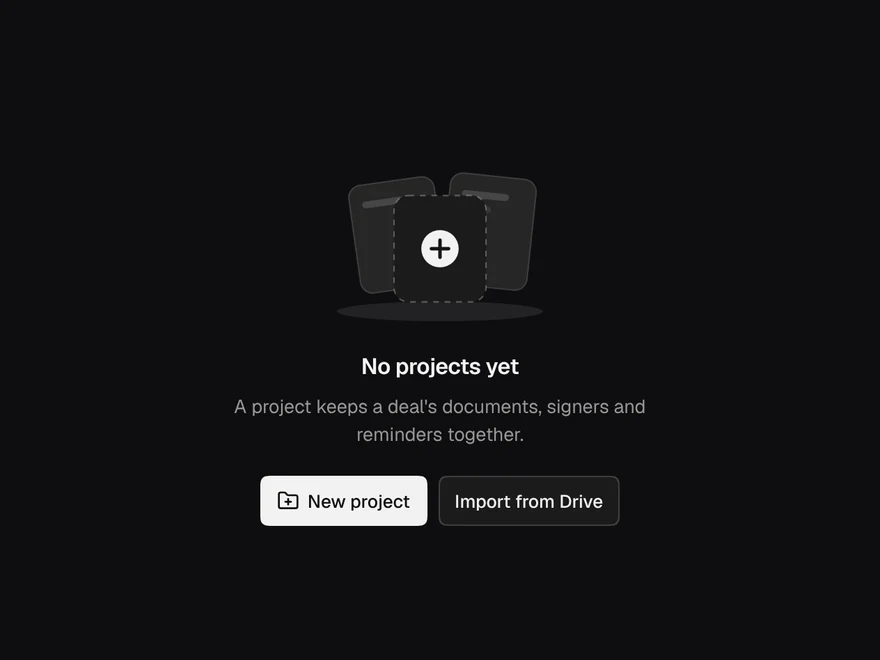
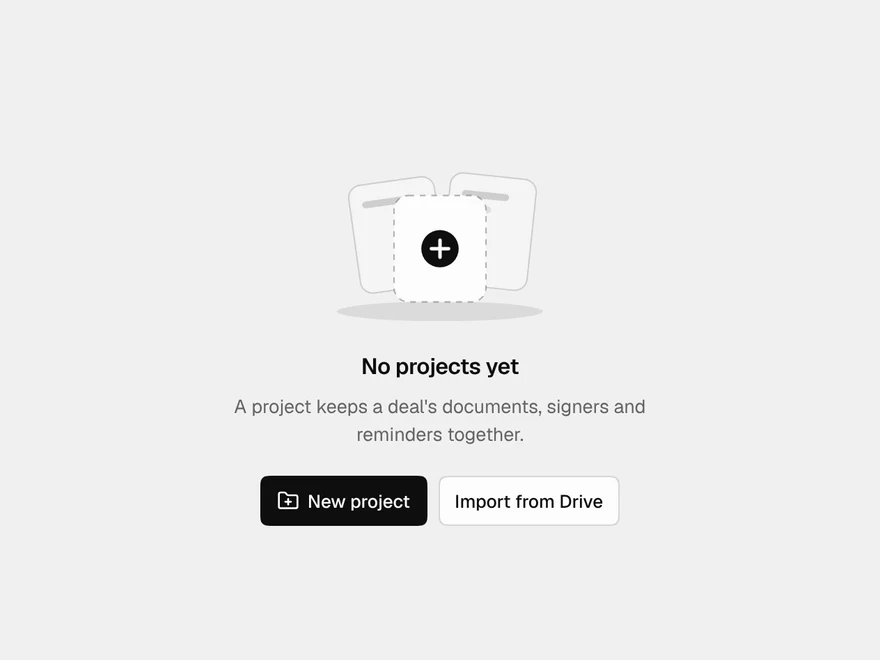
Empty States
Illustrated empty states.
 Free
Empty & Loading States
Empty, error, success and loading states.