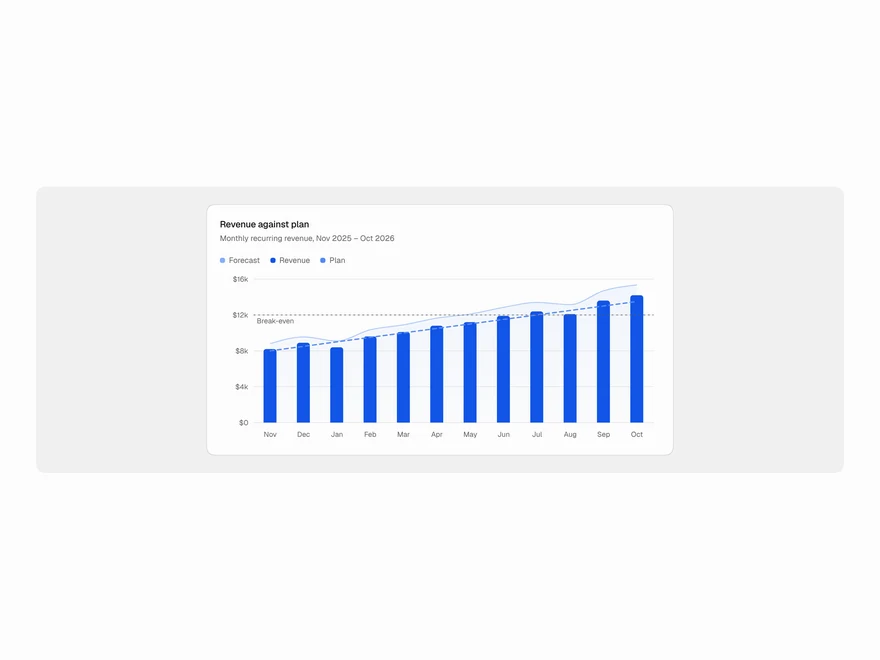
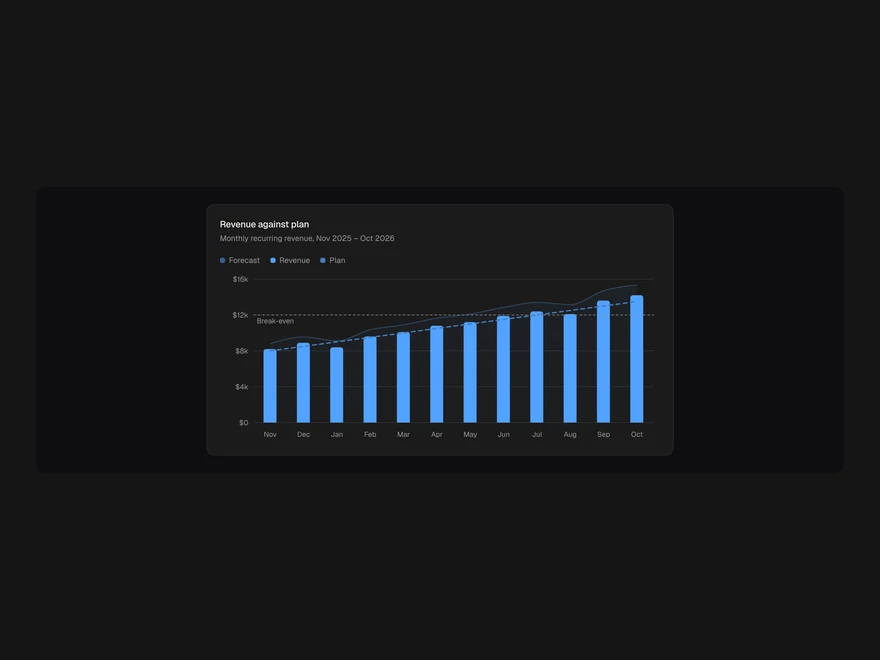
Line Chart
Change over time for up to five series: smooth, linear, step or bump curves; solid, dashed or dotted strokes; gradient and glow.
- Category
- Data & feedback
- Access
- Free with an account
- Source
- 186 lines · one file
- States
- 7 drawn
The decision inside it
Strokes tell series apart, not only colour
With a one-hue palette, dashed and dotted lines are what separate a target from the real number, and they survive a greyscale print.
When to use it
Use Line Chart for change over time with one to five series on one axis. Give a target or forecast series stroke: "dashed". Pick curve smooth, linear, step or bump, and effect gradient or glow if you want it.
Installation
How you get it
Paste this into Claude Code, Cursor, Codex or any coding agent. It installs the file and uses it as it is, instead of writing a new one.
Use Liro's Line Chart for this.
Install it: npx shadcn@latest add @liro/line-chart
(the @liro registry is set up in components.json, with LIRO_KEY in .env.local)
Import it from @/components/ui/line-chart.
Do not rewrite or restyle it. Pass my data through its props
and keep its built-in states.
For the full brief with every prop and the mistakes assistants usually make, use Copy prompt above. Free components install through the @liro registry with your CLI token: see the Namespaced tab.
Usage
import { ChartCard } from "@/components/ui/chart";
import { LineChart } from "@/components/ui/line-chart";

const data = [
  { week: "Oct 5", signed: 612, target: 600 },
  { week: "Oct 12", signed: 655, target: 600 },
  { week: "Oct 19", signed: 684, target: 600 },
];

export function SignedChart({ loading }: { loading: boolean }) {
  return (
    <ChartCard title="Documents signed" subtitle="Per week">
      <LineChart
        data={data}
        xKey="week"
        loading={loading}
        description="Documents signed per week against a target of 600"
        series={[
          { key: "signed", label: "Signed" },
          { key: "target", label: "Target", stroke: "dashed" },
        ]}
      />
    </ChartCard>
  );
}
API reference
“Copy prompt” above puts a full brief on your clipboard, install command, dependencies, props, and the mistakes an assistant usually makes with this component.
Props
Read from the component’s own TypeScript interface when the site is built, so this table cannot drift from the file you install.
| Type | Notes | ||
|---|---|---|---|
data | T[] | Yes | – |
xKey | keyof T & string | Yes | – |
series | LineSeries[] | Yes | – |
curve | LineCurve | No | Default "smooth". |
effect | LineEffect | No | Default "none". |
dots | boolean | No | Draw every point, not only on hover. |
endDot | boolean | No | Mark the last point of each line. Default true. |
format | (v: number) => string | No | Value formatter for the axis, tooltip and table. |
xFormat | (v: string) => string | No | Label formatter for the x-axis and tooltip. |
height | number | No | – |
description | string | Yes | Accessible summary, read before the data table. |
loading | boolean | No | – |
error | React.ReactNode | No | – |
onRetry | () => void | No | – |
className | string | No | – |
Dependencies
npm packages
clsxrechartstailwind-mergeLiro foundations, installed alongside it
liro-themechartStates
All of them are drawn by the component. None is left for you to design.
- Smooth
- Step
- Gradient
- Glow
- Loading
- Empty
- Error
Accessibility
- Keyboard reachable throughout, in visual order
- Focus trapped in overlays, Escape closes them
- Focus returns to whatever opened it
- Live regions announce what changed, not that something did
- Honours prefers-reduced-motion
Responsive behavior
- Sizes to its container, not the viewport
- Usable from 320px up
- Pointer-based interaction, so trackpad and touch both work
- No hover-only affordances